


- 14 日間制限なしのフル機能で利用可能!
- 1時間以内に簡単にアプリケーションの監視を開始!
- ダッシュボードやアラート、レポート作成など機能が充実!
無料評価版
ダウンロード 14 日間 フル機能を利用可能
ダウンロード 14 日間 フル機能を利用可能

サーバー監視とアプリケーションのパフォーマンス管理を簡素化するソフトウェア
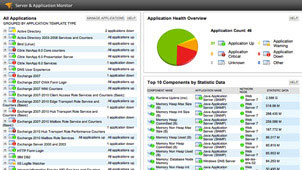
SolarWinds の Server & Application Monitor (SAM) は、サーバーとアプリケーション (カスタム アプリケーションのパフォーマンスのモニタリングを含む) を監視しパフォーマンスの問題の修正に役立つ豊富な機能を提供します。
本ビデオは、サーバーとアプリケーションのパフォーマンスを改善する方法を紹介します。
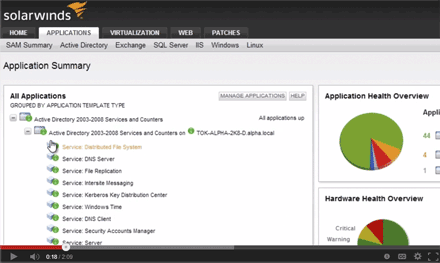
SolarWinds が提供するアプリケーション & サーバー モニタリング ソフトウェアは、エージェントが不要で、監視、アラート機能、レポート作成、サーバー管理など多くの機能が含まれています。 お手頃な価格で、使いやすいサーバー & アプリケーション パフォーマンス管理ソフトウエアは、Dell®、HP®、IBM System x®、VMware® のホストとなるハードウェアなど、さまざまなハードウェア ベンダーをサポートしています。本製品に含まれる 150 種類以上のアプリケーションのサポート (テンプレート) を駆使することで、僅かな時間で、カスタム アプリケーションのモニターを作成し、新しいアプリケーションのモニターを開始できます。 サーバー管理機能を使うことで、ネイティブにサービスの開始と停止、サーバーの再起動、不正なプロセスを強制終了することもできます。
SolarWinds Server & Application Monitor は、簡単に展開と操作、管理を行うことができます。自動的にアプリケーションとサーバーを検出するエンジンを搭載しているので、すぐに監視を開始することができます。
Server & Application Monitor (SAM) is so easy to deploy and manage – most customers only need 10% of one full-time employee (FTE) to manage the entire environment.
Within minutes of installation, the application discovery engine automatically scans your servers, discovers applications, and assigns out-of-the-box monitoring templates. No agents are needed, so deployment and maintenance is a breeze and there's no concern about slowing down your network. Additionally, the application discovery engine automatically assigns out-of-the-box monitoring templates including Microsoft® Exchange, IIS, Active Directory®, Java® applications, and Apache®.
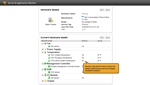
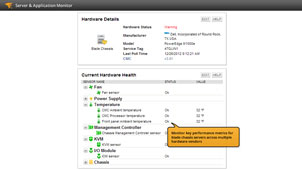
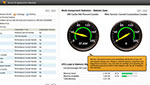
アプリケーションや仮想インフラストラクチャのヘルスとパフォーマンスに加え、マルチベンダーのハードウェア ヘルスをモニターします。SolarWinds SAM は、HP® ProLiant®、Dell™ PowerEdge™、IBM System x®、server blade chassis、および SNMP、WMI、CIM、VMware API プロトコルで VMware® ESX®/ESXi™ ホストサーバーなどの主要なヘルス インジケーターを監視します。
You aren’t monitoring your servers if you aren’t keeping an eye on hardware health. SolarWinds uniquely provides built-in server monitoring across multiple hardware vendors so you can keep abreast of hardware component failures and performance degradation.
Server & Application Monitor で、スケジュール化したルーチン タスクの状態とステータスを監視し、すべてのタスクの完了時にリアルタイムに状況を確認できます。
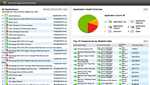
Get access to more than 150 out-of-the-box server & application performance monitors to manage all elements of your critical business applications. Built-in application monitors include:
Our Server & Application Performance Management software enables monitoring for all critical server and application elements within the same user interface. Comprehensive visibility into server, virtual machine, and application problems speeds up troubleshooting of performance issues. SolarWinds’ application management and monitoring software provides you with the capability to support monitoring for new apps in minutes!
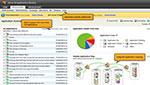
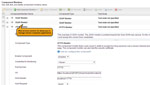
AppInsight for Exchange は、データ コレクションのルーチン タスク (1日に数十、数百にもなる PowerShell のスクリプトの実行) を自動化し、主要なエクスチェンジ パフォーマンス メトリクスでアラートとダッシュボードを提供します。
With AppInsight for Exchange, you can quickly identify and diagnose performance issues that are affecting your Exchange Server. Monitor Exchange servers in your Database Availability Group (DAG) and instantly get notified if an issue arises in a specific mail server. With AppInsight for Exchange, you can automate many Exchange admin tasks, such as:
AppInsight for Exchange quickly determines the root cause of Exchange bottlenecks by leveraging built-in expert knowledge within Server & Application Monitor.
In addition, Exchange admins can leverage the automated alerting mechanism built-in with AppInsight for Exchange. Setup alerts to instantly notify end-users that their quota is nearly reached. With SolarWinds application monitoring tool, you can customize alerts with actionable information like the number and size of the attachments, and instructions on how the user can reduce their mailbox size. With sustained thresholds , users can receive daily alerts until their mailbox size has been reduced. This automation can save Exchange admins several hours and leaves the responsibility of size reduction on the user.
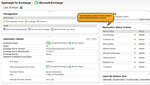
AppInsight for Exchange provides IT and Exchange admins with a range of information to monitor Exchange Server:
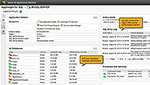
SolarWinds の AppInsight では、システム管理者、DBA、SQL 開発者向けに SQL Server® のパフォーマンス を深い階層まで確認できる機能を提供します。
AppInsight for SQL helps you quickly identify and troubleshoot SQL performance problems. With AppInsight, you have instant visibility into long-running queries and can see actual query details, so you can notify developers of the exact query issue that is causing the application performance problem.
In addition to long-running queries, AppInsight for SQL provides information on:
|
データベース
SQL Server 2005 SP3 Express, Standard
|
ストレージ 4 GB 以上 |
|
.NET Framework バージョン 3.5 またはそれ以降 (.NET Framework 4.0 推奨) |
メモリ 4 GB 以上 |
|
OS
Windows Server 2003
|
CPU 2.4 GHz 以上 |
|
Web コンソール ブラウザ
Microsoft Internet Explorer version 8 またはそれ以降と Active scripting
|
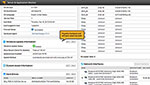
NOTE: 上記は、デフォルト構成で稼働させるための最小のシステム要件です。ポールレートや、詳細な解析情報の表示数が大幅に増えることで、より高性能な CUP やメモリーが必要になる場合があります。
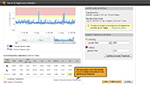
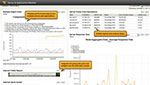
SolarWinds のサーバー & アプリケーション パフォーマンス モニタリング ソフトウェアは、ベースライン データからしきい値の計算、アプリケーションとサーバーの依存関係を確認するアラートの設定を含む、多くの時間を節約でき、アラートの数を減らすことができるテクニックを提供します。
Calculating thresholds from historical performance data saves time in adjusting thresholds and provides for more intelligent alerts. The Baseline Threshold Calculator automatically gathers baseline data and calculates warning and critical thresholds according to each workload baseline.
SolarWinds application monitoring tool provides four tiers of thresholds that can be established (good, warning, critical, and down) to help you quickly assess the difference between a system that’s up and performing poorly and a system that’s about to fail.
In addition, SolarWinds SAM lets you intelligently map applications to their virtual or physical servers. With this information, you can configure intelligent alerts that recognize app and server dependencies, allowing you to receive a single critical alert if one app or server goes down – instead of an onslaught of alerts for each of the affected servers and apps. Sustained alerts intelligently alerts you based on the number of consecutive polls, or X out of Y polls for determining warning and critical states.
Our application & server monitor lets you quickly and easily configure powerful alert engines to respond to hundreds of different scenarios, including multiple condition checks. These advanced application alerting capabilities help you recognize and correct issues before your users experience performance degradation or availability issues.
Additionally, our server & application performance monitoring software automatically escalates alerts until a problem is resolved or acknowledged. And now with integration to Alert Central, alerts can be routed to the right person, determined by alert status and on-call.
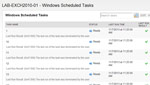
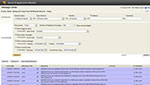
スケジュール化したルーチン タスクの状態とステータスを監視し、すべてのタスクの完了時にリアルタイムに状況を確認できます。
Whether you have a routine process to automate backups, run disk defragmentation, or scan your antivirus software, Windows Scheduled Task monitoring in Server & Application Monitor will provide a detailed overview on the results of each task. Further, it will alert you with task details, like when was the last task run, and whether the task was successful.
複合アプリケーションの監視を完全にカバーし、SaaS とその他の内部的なアプリケーションの管理に役立ちます。
Slow and unresponsive Web service APIs affects application performance. SolarWinds application monitoring software notifies you immediately when there’s a failure or malfunction with your JSON Web service. Get a detailed report through the Web-based reporting console about the problem and diagnose the issue before it affects several end-users.
Windows のイベント ログをモニタリングすることで、環境内の信頼性に問題はないか判断するのに役立ちます。また、アプリケーションやセキュリティ イベント、システム障害、DNS イベントによって記録されたログに関する情報も提供されます。リアルタイム イベント ビュアー機能は、Windows のイベント ログをリアルタイムでログのタイプ別、イベント ソース別、重大性別にフィルターします。
サーバー & アプリケーション モニターに含まれるサービスの開始と停止、プロセスの終了、サーバーの再起動などの機能を使用して、関連する問題を回復します。
With our application & server monitor, you can monitor across server critical resources, including server health monitoring, operating system performance, service health, and process status. You can also perform server management from the same award-winning user interface.
サーバー & アプリケーション モニターを使用すると、Asset Inventory Dashboard (アセット インベントリ ダッシュボード) から現在のハードウェアとソフトウェアの在庫を確認することができます。
SolarWinds Server & Application Monitor provides robust, automated IT asset inventory management to help save you time when tracking virtual and physical asset depreciation and gathering information about your entire stock of software and hardware assets.
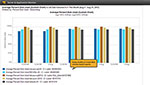
SolarWinds のアプリケーション & サーバー モニタリング ソフトウェアは、あらゆる規模の組織に拡張できるように設計されており、理論的には数千ものエンドポイントに拡張することができると実証されています。これにより、統合監視環境でハードウェア、ソフトウェア、人件費の削減に役立ちます。
SolarWinds’ products are designed to scale to organizations of all sizes, and Server & Application Monitor is proven to scale to thousands of logical endpoints. This is beneficial for organizations trying to reduce hardware, software, and labor costs by using a consolidated monitoring solution.
For companies that have distributed environments and require multiple servers and polling engines, SolarWinds provides an Enterprise Operations Console to aggregate multiple server instances over a distributed environment. With this, you can have a single interactive dashboard that displays your enterprise-wide server and application health monitored by distributed servers.
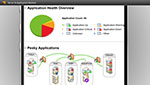
SolarWinds のアプリケーション モニタリング ソフトウェアの統合されたクロス プロダクト インターフェースの LUCID (Logical、Useable、Customizable、Interactive、Drill-down) は、迅速にパフォーマンスの問題の原因を突き止めます。
Most software vendors will tell you that their software is easy to use. At SolarWinds, we are taking “easy-to-use” to a whole new level with our LUCID Interface. Based on feedback from thousands of IT pros just like you, we have identified and implemented five critical interface attributes that simplify troubleshooting of application and server performance issues.
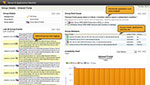
SolarWinds のアプリケーション パフォーマンス管理ソフトウェアは、アプリケーション、サービス、その他多くのビジネス サービス ビューでグループ分けすることで、分散または複合アプリケーションを厳重に監視するのに役立ちます。
Finding the root cause of an issue can be like finding a specific block in an unsorted box full of Legos®! But now you can simplify application monitoring and root cause analysis in large complex IT environments by grouping servers or applications by virtually any category.
Using the dynamic service group functionality in SolarWinds’ application & server monitoring software, you can monitor and aggregate views of server and application groups by service (such as email), location, or department - making it easier to isolate where an issue is occurring.
Integration with other SolarWinds products allows you to add even more components into these business service views, including IP SLA operations, network devices, synthetic transactions, and more.
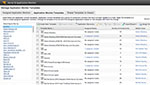
サーバー & アプリケーション モニターには、専門的なナレッジが組み込まれおり、何を監視するのか、なぜ監視するのか、また、最適なしきい値をガイドします。
When you monitor a server or application, you need to know what stats are important and what they mean. What are the optimal thresholds? What does it mean when a certain group of stats increase at the same time?
SolarWinds SAM delivers this best-practice knowledge in expert templates that provide the research and information you need. Application monitoring tools from SolarWinds provides the smarts on what to monitor, why it’s important to monitor, and provides recommendations for threshold values.
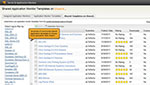
オンライン コミュニティである thwack を活用して、他のユーザーが作成したアプリケーション モニター テンプレートやスクリプトを利用することができます。インタラクティブなウェブ コンソールには、thwack 上のテンプレートとスクリプトをブラウズ、ダウンロード、共有するための直接リンクが表示されているので、他のユーザーのカスタムモニターを利用して、時間を節約することができます。
When you monitor a server or application, you need to know what stats are important and what they mean. What are the optimal thresholds? What does it mean when a certain group of stats increase at the same time?
SolarWinds SAM delivers this best-practice knowledge in expert templates that provide the research and information you need. Application monitoring tools from SolarWinds provides the smarts on what to monitor, why it’s important to monitor, and provides recommendations for threshold values.
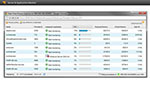
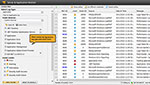
リアルタイム プロセス エクスプローラーを使用することで、対象のマシンのアクティブな統計情報を取得するために、物理的に、またはリモートで特定のマシンにログインし、タスク マネージャーを実行する必要はありません。Server & Application Monitor のユーザー インターフェースを通して、監視されている、または監視されていないプロセスの両方の情報を直接表示させることができます。
Ever have a server spike and need to know what process is causing the sudden surge?
With the Real Time Process Explorer you can launch in context from the effected node (for WMI and
SNMP monitored nodes) to find the pesky process. This feature is similar to the Processes tab found
in the Windows Task Manager.
The advantage of the Real-Time Process Explorer is that
you don’t need to physically, or remotely, log in to a particular machine and run the Task Manager
to retrieve that machine's vital statistics. Information for both monitored and unmonitored processes
is displayed directly through Server & Application Manager using this feature.
Server & Application Monitor では、SolarWinds のアプリケーション パフォーマンス管理ソフトウェアで SQL、DNS や FTP クエリーのモニタリング機能を使用して、エンドユーザーの観点からアプリケーションのパフォーマンスを測定します。
SolarWinds Server & Application Monitor (SAM) enables you to measure application performance from an end user’s perspective
with out-of-the-box SaaS monitoring and support for HTTP, HTTPS, FTP, DHCP, DNS, LDAP, POP3, IMAP4,
MAPI, Microsoft® SQL Server®, Oracle®,
IBM DB2®, and other ODBC databases. Finally, you can get a heads up on problems
and ensure that your users are happy with the performance of the applications they rely on.
Consider the case of an online retailer. Its website is its lifeblood. Ensuring that web
pages are available and performing well is critical, as downtime means immediate loss of revenue.
Application performance monitoring ensures that web servers are up and running, providing immediate
alerts if a host server crashes, a server-side error occurs or a broken link is found.
Additionally, an application monitoring tool like SolarWinds SAM can verify that web content
is being served up correctly, including checking for a specific price on a particular product page.
It can even notify an administrator of unauthorized changes to the pricing structure on the web
site. Together, these features ensure not only the health, but also the accuracy of the web infrastructure.
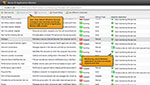
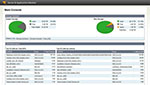
Server & Application Monitor は、単一の画面でアラートや syslog のイベント、トラップ、などのメッセージを表示して、トラブルシューティングを効率化します。
The Central Event Console in the application monitoring software is your central view for all of the notification messages about the performance of your applications and servers. This consolidated view allows you to quickly troubleshoot performance issues by analyzing SNMP trap and Syslog data from a single interface, instead of by polling various machines. Events and alerts are also routed to this interface, allowing you to perform manual event correlation and basic root cause analysis.
Server & Application Monitor の Web ベースのレポーティング機能で、パフォーマンス、有効性、在庫状況などのレポートを簡単に、生成、カスタマイズ、および共有することができます。
Server & Application Monitor offers 100+ out-of-the-box reports to show server and application availability and performance. All reports can be easily modified, and custom reports can be easily created. A simple interface facilitates modification of built-in reports, as well as easy creation of custom reports with the Web console-based Report Writer or any standard SQL reporting service. Reports can be tailored for a department or recipient, and automated report delivery is offered via email.
Server & Application Monitor は、エンドツーエンドのインフラストラクチャー モニター用に、SCOM (System Center Operations Manager) 2012、SolarWinds Network Performance Monitor、および Storage Manager と統合します。
When used together, SolarWinds Server & Application Monitor, Storage Manager, and Network Performance Monitor deliver an end-to-end view into network, server, storage, and application performance through an integrated Web console. Not only will you get a single pane of glass for all of your monitoring data, you’ll also love the intuitive charts, graphs, tables, alerting, top 10 lists, and reporting views that Server & Application Monitor shares with other SolarWinds products.
By delivering an integrated, unified console, our application & server monitoring software enables you to visually track
the overall health of the application and server infrastructure and quickly troubleshoot issues
by identifying whether the problem stems from an application, server, storage, or network issue.
With SolarWinds SAM, you won’t have to run multiple point products or toggle between screens to view the application and network data you need to troubleshoot problems.
Using the SolarWinds Management Pack, you can also visualize application alerts coming from Server & Application Monitor, Network Performance Monitor, and Web Performance Monitor in System Center Operations Manager 2012. There are several benefits to adding Server & Application Monitor to your SCOM environment:
既存の Microsoft Active Directory® のユーザー アカウントを用いて Server & Application Monitor のログイン認証を行うことができます。
Leverage your existing Microsoft Active Directory user accounts to allow users to log into SolarWinds Server & Application
Monitor (SAM). Users and groups can automatically login using custom username/password or optionally
use an AD pass-through login to bypass the login screens altogether.
As an administrator, you can customize each account and specify which types of information
are displayed within the application monitoring software interface for a particular department,
group, or user. This ensures that only the people who need to view specific information have access
to it, providing an increased level of internal security.
For example, our application
& server monitoring software can be configured so that the server team only sees the servers
on the network, while the Texas IT group has a view limited to the geography for which they are
responsible. Even better, you can further customize these views by creating a page layout specific
to an account—changing the color palette and modifying toolbars. Of course, this functionality
also allows you to simplify views for business executives to pretty pictures and single syllable
words!
SolarWinds の Server & Application モニタリング ソフトウェアには、Movile View があり、iPhone や Blackberry、Android などのポピュラーなモバイルのウェブ ブラウザからもサーバーやアプリケーションのパフォーマンスを監視したり、アラート認証の確認を行ったりすることができます。
Increase your productivity from both inside and outside the office. Whether you are in a meeting or at a coffee shop, with SolarWinds Server & Application Monitor (SAM) Mobile Views, you can monitor server and application performance from your mobile browser. Supported browsers include iPhone, Blackberry, and Android. You can also acknowledge alerts. Or, for even more mobile administration power, check out SolarWinds Mobile Admin and put over 40 IT technologies in your mobile device including SolarWinds Orion, Exchange, Active Directory, Windows Server, and more.
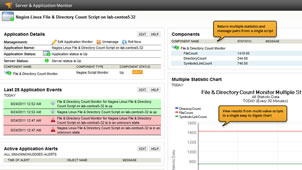
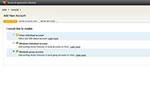
Server & Application Monitor では、サービス、プロセス、ポート、スクリプト、WMI パフォーマンス カウンター、および Nagios などサード パーティのオープン ソースのスクリプト用のコンポーネント モニターを含むカスタム アプリケーションを簡単にモニターできます。
SolarWinds SAM makes it easy to extend out-of-the-box monitors, using WMI performance monitors, the Application Monitor Wizard, and script monitoring.
Server & Application Monitor (SAM) の柔軟で拡張性のあるアプリケーションの監視方法を確認することができます。このライブデモにより、アプリケーションとアプリケーションが起動するサーバーの監視、アラートによる警告、レポートの作成が簡単にできることを確認できます。
ネットワーク上で何が起こっているか知るには、まずアプリケーションに何が起こっているかいるか知る必要があります。
本ビデオでは、複数のハードウェア ベンダーを監視し、約 150 種類のアプリケーションの監視をする方法が確認できます。カスタム アプリケーションの場合でも、Server & Application Monitor ならカスタム アプリケーションの監視も数分で開始できます。
カスタム アプリケーションの監視は簡単ではありませんが、SolarWinds SAM を使うことで、シンプルなウィザードでカスタム アプリケーションの監視が可能です。本ビデオは、カスタム アプリケーションの監視方法を紹介します。
Server & Application Monitor (SAM) は、カスタム アプリケーションの監視を含む、サーバーとアプリケーションの監視と問題の修正を行う堅牢な機能を提供します。本ビデオでは、SAM の概要と主な機能について紹介します。
Exchange は、非常に多くのパフォーマンス カウンターを顕在化させます。あなたは環境内の監視の重要性と最適なしきい値をご存じですか?また、何かがうまくいかない場合はどうしていますか?是非、このビデオを参考にしてください。
SolarWinds Server & Application Monitor 管理者ガイドで、詳細なセットアップ方法、設定方法、概念などを確認できます。(日本語)
Q:AppInsight のテンプレートは自分でカスタマイズ可能ですか?
A:いいえ。クエリーが設定されているため、AppInsight 機能をカスタマイズすることはできません。
Q:なぜ Server & Application Monitor は、サーバー数ではなく、モニター数でライセンスされるのですか?
A:以前、サーバー数の価格設定よりモニター数で価格設定を行った方がフレキシブルだという意見をいただきました。 サーバー数の価格設定では、重要なプロセスを一つ持つサーバーのコストと、複数のプロセス、サービス、ユーザー エクスペリエンス モニターから成る複数のアプリケーションを持つサーバーのコストが同じなってしまします。 モニター数での価格設定の方が、より製品に対する価格感が分かりやすくなります。 詳しくは、 こちらをご覧ください。


