MPI、OpenMP、C/C++、F90 向けプロファイラ
機能
Profiler Features and Benefits
We believe scientists and developers should be set free to spend their time and energy doing great science and code - not battling with arcane or unnecessarily complex tools. Allinea MAP is our way of giving time back to you - it is a profiler that shows developers exactly where and why code is losing performance. It provides:
- Effortless code profiling - without needing to change your code or - on most systems - the way you build it.
- Profiling for applications running on more than one server and multiple processes - such as on HPC clusters using MPI.
- Clear views of bottlenecks in I/O, in compute, in thread or in multi-process activity.
- Deep insight into actual processor instruction types that affect your performance such as vectorization and memory bandwidth.
- Memory usage over time to discover high-watermarks and changes in complete memory footprint.
- A powerful, navigable source browser in which you can edit, build and commit your changes - with outstanding support for working on remote systems.
More results, faster
Profiling your C++, C, Fortran or F90 code on Linux is as simple as running "map -profile my_program.exe". There are no extra steps and no complicated instrumentation. MPI, OpenMP, pthreads or unthreaded codes can all be profiled with Allinea MAP.
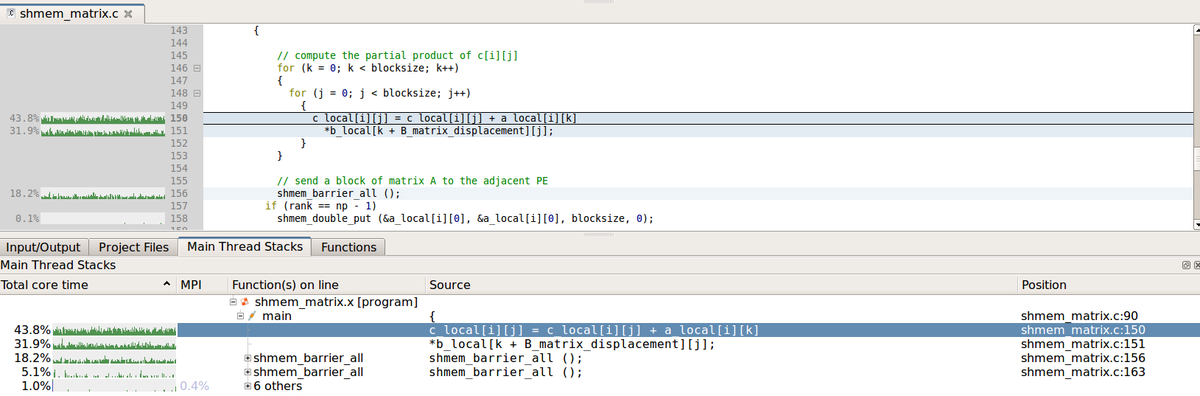
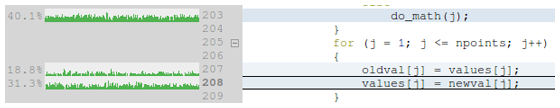
The graphical results are precise, straightforward to interpret and bottlenecks are shown directly in the source code.
Integration and a common interface with the debugger Allinea DDT in the Allinea Forge tool suite makes moving between tools a breeze, saving you time and energy throughout each stage of the development cycle.
Low-overhead profiling: for production and test workloads at any scale
Existing performance tools can give a powerful view, when you run them and spend the time analyzing their output, but when was the last time you ran a profiler on your production code?
We built Allinea MAP with less than 5% runtime overhead - and the data files created by MAP remain small, for any size and duration of run - so you can run it every day, on every change, giving you fascinating and powerful insights into the performance of real codes under real conditions.
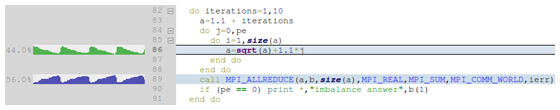
Fundamental to MAP is that it shows time alongside your source code - so that bottlenecks are clearer to see, and the top-down stack view of time across all processes means its easy to navigate through the code to the parts that matter.
I/O profiling
As systems get larger, more and more codes are being affected by poor I/O performance. Often, this goes unnoticed or mislabelled as poor application scaling. Allinea MAP shows you exactly where your file I/O bandwidth is being used, helping to diagnose overloaded shared filesystems, poor read/write patterns and even system misconfiguration issues.
Profiling threads and OpenMP code
Getting performance from multithreaded code can be a challenge - but Allinea MAP makes it easy to see where thread synchronization is costing cycles and where threads are spending their time.
With views of CPU core activity, and code profiling by actual per-core walltime, Allinea MAP is the thread profiler that threaded code has been waiting for - it's unique in profiling threads accurately and quickly on real workloads.
To learn more about OpenMP profiling:
- Read our OpenMP profiling blog explores how MAP profiles threads.
- Watch a video on profiling an OpenMP genomics code with MAP.
MPI Profiling
At the core of Allinea MAP is a scalable architecture that lets it profile hundreds, or thousands of parallel processes - such as those in HPC's main communication library, MPI. It gathers performance data from each process, and merges the information to present why and where your MPI or multiprocess code is slow. MAP works with almost every MPI implementation so that your users have the fastest and most pain free experience of profiling their MPI code.
To learn more about MPI profiling with Allinea MAP:
- Read our blog introducing MPI in Allinea MAP
- Watch a video on profiling a CFD MPI code - as we find a surprising I/O bottleneck.
Memory Profiling

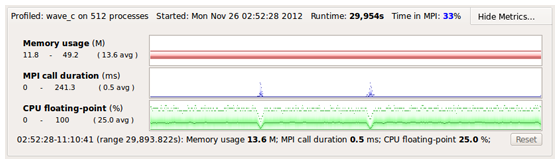
As your application progresses, Allinea MAP can show you the real memory usage across all processes in the application and all compute nodes/servers. The memory usage helps you identify imbalance, or changes caused by phases in your application - and MAP shows this alongside your source code. The visible high-water mark of usage helps to track down applications that rely on 3rd party libraries which temporarily consume memory and push memory usage over the edge. For applications that use increasing memory over time, potential memory leaks can then be addressed with Allinea DDT's in-built memory debugging.
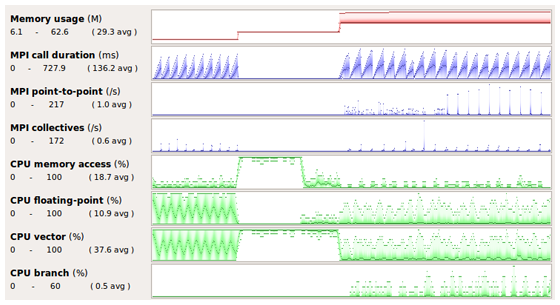
Additionally, the time spent in memory accesses is one of the key metrics profiled so that poor memory access patterns and cache use are found easily.
Accelerator Metrics
Allinea MAP supports the latest NVIDIA CUDA GPUs and helps you to profile CUDA GPUs and the CPUs together. Profiling enables you to see how your CPU waits for GPU completion - and view CUDA GPU time in global memory access, GPU utilization and even GPU temperature.
For further information:
- Read more about MAP's features for profiling codes that use CUDA.
- Watch a video on Allinea Forge helping developers to use CUDA and OpenACC effectively at NVIDIA's GTC conference.
Energy Profiling
Energy consumption and peak power usage is increasingly important for high-performance applications and their users. With Allinea MAP's Energy Pack,developers can optimize for time and energy.
The latest Sandy Bridge and above Intel processors are supported (including Haswell and Broadwell chips) - via their in-built Intel RAPL power measurement capability - for CPU power measurement. GPU power measurement is available on any NVIDIA GPU with power monitoring support. Node-level measurement is also available for systems supporting the Intel Energy Checker API or the Cray HSS energy counters (XK6 and XC30 and above).
Compare the performance of different clusters and architectures
Allinea MAP is cross-platform profiler supporting the major Linux platforms. It provides its data in an open XML format, making it ideal for post-processing to characterize and compare the performance of key codes on different hardware platforms.
Even without access to the original source code, Allinea MAP tracks and reports on CPU, memory and MPI performance metrics over time, giving you everything you need to evaluate and compare potential new platforms.
Allinea MAP supports all of today's leading technical-computing platforms - which means you can be productive on any system.
It's an MPI profiler, a multi-threaded profiler and an OpenMP profiler - and supports mixed hybrid programming models.
Architectures
Intel Xeon Phi , NVIDIA CUDA , OpenPOWER, ARM 8 (64 bit), Intel Xeon
Models
MPI, OpenMP, CUDA , OpenACC, UPC, PGAS Languages, pthread-based multithreading, SHMEM, OpenSHMEM
Languages
Fortran, C++, C++11, C, PGAS Languages
Free up support staff time to solve key challenges
HPC consultants and support staff have a deep understanding of performance and optimization tools. Yet again and again they tell us much of their time is spent diagnosing the same basic mistakes new programmers make over and over.
We designed Allinea MAP so that new developers of MPI, OpenMP and regular code can see the cause of common performance problems at once, freeing up experts to dive deeper into complex and leadership-class optimization problems.