フィボナッチ リトレースメントは、トレーディングのトレンドを理解するため、チャート上にサポートおよびレジスタンス ラインを導入するテクニカル分析の手法の 1 つです。今回のチュートリアルでは、ローソク足チャートにおけるフィボナッチ リトレースメントの作成方法を紹介します。
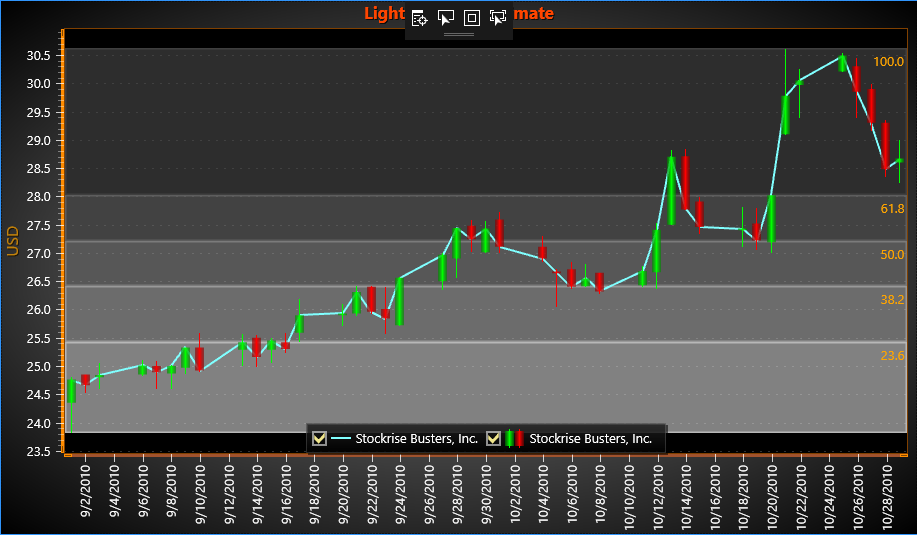
このチュートリアルでは、新規の WPF プロジェクトを作成し、フィボナッチ比率に基づいた 0%、23.6%、38.2%、50%、61.8% および 100% の水準を適用します。
- フィボナッチ リトレースメントのソース コードは、下記のボタンからダウンロードできます。
作成手順
新規の WPF プロジェクトを作成します。
※ 今回のアプリ開発では、セミバインド可の LightningChart .NET を使用します。XAML のデザイナーで、チャートを作成します。
    <Window x:Class="WpfTradingFibonacciBands.MainWindow"
            xmlns="http://schemas.microsoft.com/winfx/2006/xaml/presentation"
            xmlns:x="http://schemas.microsoft.com/winfx/2006/xaml"
            xmlns:lcu="http://schemas.arction.com/semibindablecharting/ultimate/"
            Title="MainWindow" Height="350" Width="525">
        <Grid Name="gridMain">
            <lcu:LightningChartUltimate Name="_chart">
                <lcu:LightningChartUltimate.ViewXY>
                    <lcu:ViewXY>
                        <lcu:ViewXY.GraphBackground>
                            <lcu:Fill Color="Black" GradientFill="Solid"/>
                        </lcu:ViewXY.GraphBackground>
                        <lcu:ViewXY.YAxes>
                            <lcu:AxisY/>
                        </lcu:ViewXY.YAxes>
                        <lcu:ViewXY.XAxes>
                            <lcu:AxisX/>
                        </lcu:ViewXY.XAxes>
                    </lcu:ViewXY>
                </lcu:LightningChartUltimate.ViewXY>
            </lcu:LightningChartUltimate>
        </Grid>
    </Window>
コード エディターで using 構文を追加します。
            // Arction の using 構文を追加
            using Arction.Wpf.SemibindableCharting;
            using Arction.Wpf.SemibindableCharting.SeriesXY;
            using Arction.Wpf.SemibindableCharting.Axes;
            using Arction.Wpf.SemibindableCharting.Views.ViewXY;
            using Arction.Wpf.SemibindableCharting.Annotations;
XAML にインタラクションのロジックを追加します。
            /// <summary>
            /// MainWindow.xaml にロジックを追加
            /// </summary>
            public partial class MainWindow : Window
            {
                private ContextMenu _contextMenu = null;
                private Point _mouseDownCoords;
            }
フィボナッチ比率を追加します。
            // 50 はフィボナッチ数列には含まれませんが、トレーディングでは頻繁に使用されます。
            private double[] FibonacciLevels = { 0, 23.6, 38.2, 50, 61.8, 100 };
右クリックのメニューを作成します。
            public MainWindow()
            {
                InitializeComponent();

                InitChart();

                // メニューを作成
                _contextMenu = new ContextMenu();

            MenuItem item = new MenuItem();

                item.Header = "Show / hide Fibonacci retracement";
                item.Click += item_Click;

                _contextMenu.Items.Add(item);

                 _chart.ContextMenu = _contextMenu;
            }

            void item_Click(object sender, RoutedEventArgs e)
            {
                MenuItem m = sender as MenuItem;
                if (m != null)
                {
                    _chart.BeginUpdate();
                    foreach (Band band in _chart.ViewXY.Bands)
                    {
                        band.Visible = !band.Visible;
                    }

                    _chart.EndUpdate();
                }
            }
レンダリングを無効化して、チャートのプロパティを更新します。
            _chart.BeginUpdate();


            _chart.ViewXY.DropOldSeriesData = false; // 古いデータを記録
レジェンド ボックスを設定します。
            _chart.ViewXY.LegendBoxes = ViewXY.CreateDefaultLegendBoxes();
            _chart.ViewXY.LegendBoxes[0].Visible = true;
            _chart.ViewXY.LegendBoxes[0].Position = LegendBoxPositionXY.TopRight;
            _chart.ViewXY.LegendBoxes[0].Offset.SetValues(0, 0);
X 軸を構成します。
            AxisX xAxis = _chart.ViewXY.XAxes[0];
            xAxis.ScrollMode = XAxisScrollMode.None;
            xAxis.Title.Visible = false;
            xAxis.AutoFormatLabels = false;
            xAxis.MajorGrid.Visible = false;
            xAxis.MinorDivTickStyle.Visible = false;
            xAxis.LabelsAngle = 90;
            xAxis.LabelsTimeFormat = System.Globalization.CultureInfo.CurrentCulture.DateTimeFormat.ShortDatePattern;
            xAxis.AutoDivSpacing = false;
            // 1日を秒単位で表記します。
            xAxis.MajorDiv = 24 * 60 * 60;

            string strStockName = "Stockrise Busters, Inc.";
Y 軸の範囲を指定します。
            AxisY axisSharePrice = _chart.ViewXY.YAxes[0];
            axisSharePrice.SetRange(60, 90);
            axisSharePrice.MinorGrid.Visible = false;
            axisSharePrice.Title.Text = "USD";

            Color color = Colors.Orange;
            axisSharePrice.Title.Color = Color.FromArgb(180, color.R, color.G, color.B);
            axisSharePrice.MajorGrid.Color = Color.FromArgb(50, 255, 255, 255);
ストック系列を追加します。
            StockSeries stockSeries = new StockSeries(_chart.ViewXY, chart.ViewXY.XAxes[0], axisSharePrice);
            stockSeries.FillBorder.Style = BorderType.None;
            stockSeries.Name = strStockName;
            stockSeries.Title.Text = strStockName;
            stockSeries.ItemWidth = 9;
            stockSeries.StickWidth = 1;
データをストック系列に入力します。
            // データ配列を作成
            StockSeriesData[] data = new StockSeriesData[] {
                new StockSeriesData(2010,09,01, 24.35, 24.76, 24.81, 23.82, 269210, 6610451.55),
                new StockSeriesData(2010,09,02, 24.85, 24.66, 24.85, 24.53, 216395, 5356858.225),
                new StockSeriesData(2010,09,03, 24.80, 24.84, 25.07, 24.60, 164583, 4084950.06),
                new StockSeriesData(2010,09,06, 24.85, 25.01, 25.12, 24.84, 118367, 2950889.31),
                new StockSeriesData(2010,09,07, 25.00, 24.89, 25.10, 24.60, 210504, 5251022.28),
                new StockSeriesData(2010,09,08, 24.87, 25.00, 25.03, 24.61, 151786, 3784783.91),
                new StockSeriesData(2010,09,09, 24.97, 25.33, 25.33, 24.86, 142280, 3578342),
                new StockSeriesData(2010,09,10, 25.33, 24.92, 25.60, 24.90, 293428, 7372378.5),
                new StockSeriesData(2010,09,13, 25.29, 25.42, 25.57, 25.01, 156204, 3960552.42),
                new StockSeriesData(2010,09,14, 25.50, 25.16, 25.56, 25.00, 164878, 4176359.74),
                new StockSeriesData(2010,09,15, 25.29, 25.45, 25.51, 25.07, 219961, 5580410.57),
                new StockSeriesData(2010,09,16, 25.42, 25.30, 25.59, 25.24, 109173, 2768627.28),
                new StockSeriesData(2010,09,17, 25.59, 25.90, 26.20, 25.43, 435968, 11223996.16),
                new StockSeriesData(2010,09,20, 25.90, 25.93, 26.10, 25.72, 221870, 5749761.05),
                new StockSeriesData(2010,09,21, 25.93, 26.31, 26.42, 25.89, 297268, 7764640.16),
                new StockSeriesData(2010,09,22, 26.40, 25.96, 26.42, 25.93, 247470, 6478764.6),
                new StockSeriesData(2010,09,23, 26.01, 25.84, 26.40, 25.57, 189544, 4913928.2),
                new StockSeriesData(2010,09,24, 25.72, 26.56, 26.58, 25.72, 157053, 4105365.42),
                new StockSeriesData(2010,09,27, 26.50, 26.97, 27.00, 26.36, 179097, 4788158.295),
                new StockSeriesData(2010,09,28, 26.90, 27.44, 27.44, 26.56, 342460, 9304638.2),
                new StockSeriesData(2010,09,29, 27.48, 27.24, 27.60, 27.02, 227424, 6222320.64),
                new StockSeriesData(2010,09,30, 27.01, 27.43, 27.57, 27.01, 176893, 4815027.46),
                new StockSeriesData(2010,10,01, 27.59, 27.11, 27.74, 27.00, 192182, 5256177.7),
                new StockSeriesData(2010,10,04, 27.11, 26.90, 27.31, 26.85, 166542, 4497466.71),
                new StockSeriesData(2010,10,05, 26.67, 26.64, 26.72, 26.06, 650758, 17345954.49),
                new StockSeriesData(2010,10,06, 26.71, 26.40, 26.85, 26.37, 335201, 8901262.555),
                new StockSeriesData(2010,10,07, 26.41, 26.55, 26.81, 26.41, 267515, 7083797.2),
                new StockSeriesData(2010,10,08, 26.65, 26.32, 26.65, 26.28, 292845, 7755999.825),
                new StockSeriesData(2010,10,11, 26.43, 26.68, 26.78, 26.40, 167057, 4436198.635),
                new StockSeriesData(2010,10,12, 26.66, 27.41, 27.53, 26.38, 310791, 8402234.685),
                new StockSeriesData(2010,10,13, 27.50, 28.70, 28.83, 27.50, 453671, 12748155.1),
                new StockSeriesData(2010,10,14, 28.71, 27.77, 28.84, 27.77, 439874, 12422041.76),
                new StockSeriesData(2010,10,15, 27.91, 27.46, 28.00, 27.35, 239784, 6638420.04),
                new StockSeriesData(2010,10,18, 27.40, 27.43, 27.82, 27.12, 181351, 4971737.665),
                new StockSeriesData(2010,10,19, 27.52, 27.22, 27.81, 27.06, 239276, 6548984.12),
                new StockSeriesData(2010,10,20, 27.19, 28.02, 28.02, 27.00, 181063, 4998244.115),
                new StockSeriesData(2010,10,21, 29.10, 29.78, 30.62, 29.10, 896709, 26399112.96),
                new StockSeriesData(2010,10,22, 29.97, 30.05, 30.27, 29.40, 341932, 10261379.32),
                new StockSeriesData(2010,10,25, 30.21, 30.49, 30.54, 30.21, 362823, 11011678.05),
                new StockSeriesData(2010,10,26, 30.30, 29.85, 30.45, 29.40, 318239, 9571037.925),
                new StockSeriesData(2010,10,27, 29.90, 29.30, 30.00, 29.16, 170894, 5058462.4),
                new StockSeriesData(2010,10,28, 29.30, 28.48, 29.36, 28.36, 256130, 7399595.7),
                new StockSeriesData(2010,10,29, 28.60, 28.67, 29.00, 28.25, 246450, 7057095.75),

            };
            stockSeries.DataPoints = data;
作成した系列をリストに追加します。
_chart.ViewXY.StockSeries.Add(stockSeries);X 軸の両端を半日分引き伸ばします。
            xAxis.SetRange(
                xAxis.DateTimeToAxisValue(stockSeries.DataPoints[0].Date) - 12 * 60 * 60,
                xAxis.DateTimeToAxisValue(stockSeries.DataPoints[stockSeries.DataCount - 1].Date) + 12 * 60 * 60);
            bool bFitted = false;
Y 軸の範囲を合わせます。
axisSharePrice.Fit(5.0, out bFitted, true, false);ポイント ライン系列を追加し、データを設定します。
            // ストック系列の終値からジャンプ
            PointLineSeries pls = new PointLineSeries(_chart.ViewXY, _chart.ViewXY.XAxes[0], _chart.ViewXY.YAxes[0]);
            pls.LineStyle.Color = Color.FromArgb(255, 128, 255, 255);
            pls.Title.Text = strStockName;

            int pointCount = stockSeries.DataCount;
            SeriesPoint[] aLineSeriesPoints = new SeriesPoint[pointCount];
            for (int pointIndex = 0; pointIndex < pointCount; pointIndex++)
            {
                aLineSeriesPoints[pointIndex].X = _chart.ViewXY.XAxes[0].DateTimeToAxisValue(data[pointIndex].Date);
                aLineSeriesPoints[pointIndex].Y = data[pointIndex].Close;
            }
            pls.Points = aLineSeriesPoints; //系列にデータを割り当て

            _chart.ViewXY.PointLineSeries.Add(pls); // 作成したポイント ライン系列をリストに追加
フィボナッチ数列のバンドを作成します。
            double yMin, yMax;
            stockSeries.GetMinMaxFromXRange(out yMin, out yMax, xAxis.Minimum, xAxis.Maximum, false);

            for (int i = 1; i < FibonacciLevels.Length; i++)
            {
                Band band = new Band(_chart.ViewXY, xAxis, axisSharePrice);
                band.Binding = AxisBinding.YAxis;
                band.Behind = true;

                double minToMax = yMax - yMin;

                double bandMin, bandMax;
                if (i == 1)
                bandMin = yMin;
                else
                bandMin = yMin + FibonacciLevels[i - 1] / 100.0 * minToMax;

                bandMax = yMin + FibonacciLevels[i] / 100.0 * minToMax;

                band.SetValues(bandMin, bandMax);

                // 白い濃い灰色の間のステップとして色付け
                band.Fill.GradientFill = GradientFill.Solid;

                band.Fill.Color = ChartTools.CalcGradient(Color.FromArgb(150, 255, 255, 255), Color.FromArgb(150, 40, 40, 40)
                , (double)i / (double)(FibonacciLevels.Length) * 100.0);
                band.IncludeInAutoFit = false;
                band.Title.Text = FibonacciLevels[i].ToString("0.0");
                band.Title.Visible = true;
                band.Title.Color = Colors.Orange;
                band.ShowInLegendBox = false;
                band.MouseInteraction = false;
                band.BorderColor = band.Fill.Color;
                band.BorderWidth = 1.5f;
                _chart.ViewXY.Bands.Add(band);
            }
イベント ハンドラーを追加し、チャートのレンダリングを再開します。
            _chart.PreviewMouseDown += _chart_PreviewMouseDown;
            _chart.PreviewMouseUp += _chart_PreviewMouseUp;

            _chart.ViewXY.LegendBoxes[0].Position = LegendBoxPositionXY.SegmentBottomCenter;

            _chart.EndUpdate();
閾値を超えた場合、コンテキスト メニューを開きます。
void _chart_PreviewMouseUp(object sender, MouseButtonEventArgs e) { if (e.ChangedButton == MouseButton.Right) { Point p = e.GetPosition(_chart); //Open context menu if panning threshold exceeded if (Math.Abs(p.X - _mouseDownCoords.X) < _chart.ViewXY.ZoomPanOptions.MousePanThreshold && Math.Abs(p.Y - _mouseDownCoords.Y) < _chart.ViewXY.ZoomPanOptions.MousePanThreshold) { _contextMenu.Visibility = System.Windows.Visibility.Visible; } else { _contextMenu.Visibility = System.Windows.Visibility.Hidden; } } } void _chart_PreviewMouseDown(object sender, MouseButtonEventArgs e) { if (e.RightButton == MouseButtonState.Pressed) { _mouseDownCoords = e.GetPosition(_chart); } }- アプリケーションをビルドおよび実行します。
