このチュートリアルは、View3D の Polygon3D オブジェクトを使用して、マンハッタン プロットの 3D スタック チャートを作成する方法を紹介します。LightningChart では、マンハッタン プロットを簡単に生成できます。しかし、マンハッタン
プロットをスタック チャートとして視覚化するためには、いくつかの工夫が必要になります。
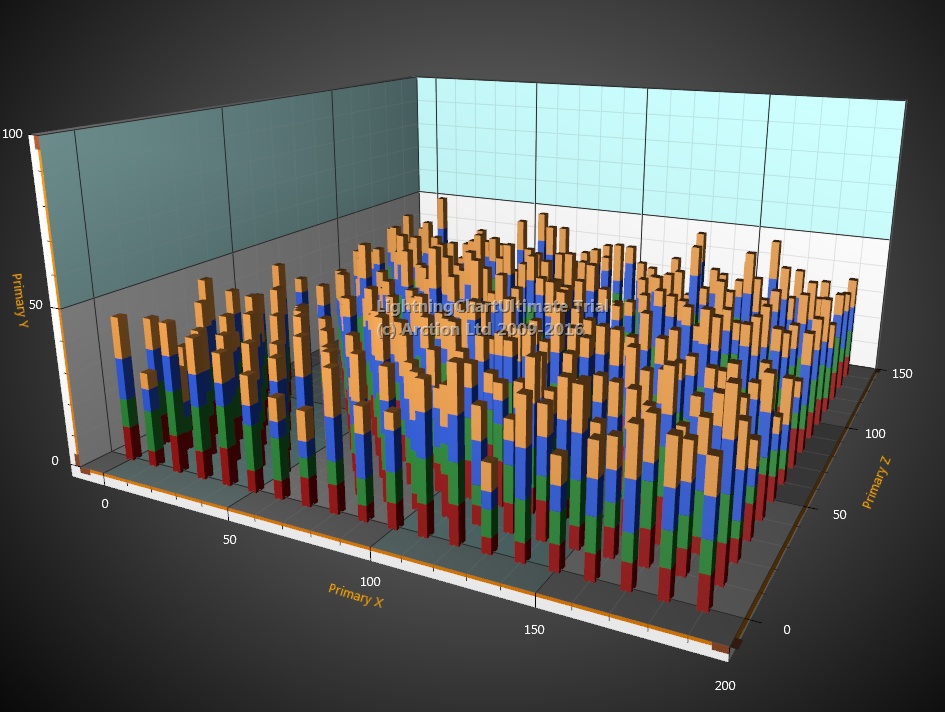
このチュートリアルでは、セミバインド可の WPF プロジェクトを使用して、マンハッタン プロットを 3D スタック チャートとして生成する方法を紹介します。
- マンハッタン プロットを 3D スタック チャートとして作成するためのソース コードは、下記のボタンからダウンロードできます。
作成手順
新規の WPF プロジェクトを作成します。
※ 今回のアプリ開発では、セミバインド可の LightningChart .NET を使用します。空のウィンドウに、グリッドのみを追加します。
<Window x:Class="WpfApplication1.MainWindow"
    xmlns="http://schemas.microsoft.com/winfx/2006/xaml/presentation"
    xmlns:x="http://schemas.microsoft.com/winfx/2006/xaml"
    Title="MainWindow" Height="350" Width="525">
  <Grid Name="gridMain">

  </Grid>
</Window>
コード エディターで using 構文を追加します。
          // Arction の using 構文を追加
          using Arction.Wpf.SemibindableCharting.Axes;
          using Arction.Wpf.SemibindableCharting;
          using Arction.Wpf.SemibindableCharting.Views;
          using Arction.Wpf.SemibindableCharting.Views.View3D;
          using Arction.Wpf.SemibindableCharting.Series3D;
PolygonSeries3D を使用して、チャートを作成します。
          /// <summary>
          /// マンハッタン プロットのスタック チャートを作成
          /// </summary>
          public partial class MainWindow : Window
          {

              private LightningChartUltimate _chart;
              private List _listBars = new List();


              private const int ColCount = 20;
              private const int RowCount = 15;
              private const int StackCount = 4;

              public MainWindow()
              {
                  InitializeComponent();
                  CreateBarData();
                  CreateChart();
              }
          }
マンハッタン プロットで使用される棒グラフのデータを作成します。
          void CreateBarData()
          {

              // 棒グラフのデータを作成
              Random rand = new Random();

              for (int colIndex = 0; colIndex < ColCount; colIndex++)
              {
                  for (int rowIndex = 0; rowIndex < RowCount; rowIndex++)
                  {
                      for (int stackIndex = 0; stackIndex < StackCount; stackIndex++)
                      {
                          Bar bar = new Bar(colIndex, rowIndex, stackIndex, 5 + rand.Next(0, 10));
                           _listBars.Add(bar);
                      }
                  }
               }

          }


          void CreateChart()
          {

              _chart = new LightningChartUltimate();
              _chart.ActiveView = ActiveView.View3D;

              View3D v = _chart.View3D;
              const double MinX = 0;
              const double StepX = 10;
              const double MinZ = 0;
              const double StepZ = 10;
              const double SizeX = 3;
              const double SizeZ = 3;

              v.Lights = View3D.CreateDefaultLights();


              foreach(Bar bar in _listBars)
              {
                  double x = MinX + bar.ColumnIndex * StepX;
                  double z = MinZ + bar.RowIndex * StepZ;
                  Color c = DefaultColors.SeriesWpf[bar.StackIndex % DefaultColors.SeriesWpf.Length];
                  double yMin,yMax;
                  SolveYMinMax(bar, out yMin, out yMax);
                  CreatePolygon3D(x, z, yMin, yMax, c, SizeX, SizeZ);

              }

              v.XAxisPrimary3D.SetRange(MinX-StepX, MinX + ColCount * StepX);
              v.YAxisPrimary3D.SetRange(0, 100);
              v.ZAxisPrimary3D.SetRange(MinZ-StepZ, MinZ + RowCount * StepZ);

              gridMain.Children.Add(_chart);
          }


          Polygon3D CreatePolygon3D(double xCenter, double zCenter, double yMin, double yMax, Color color, double sizeX, double sizeZ)
          {

              Polygon3D polygon = new Polygon3D(_chart.View3D, Axis3DBinding.Primary, Axis3DBinding.Primary, Axis3DBinding.Primary);
              polygon.Material.DiffuseColor = color;

              polygon.Points = new Polygon3DPoint[] {
                  new Polygon3DPoint(xCenter - sizeX/2.0, zCenter - sizeZ/2.0),
                  new Polygon3DPoint(xCenter - sizeX/2.0, zCenter + sizeZ/2.0),
                  new Polygon3DPoint(xCenter + sizeX/2.0, zCenter + sizeZ/2.0),
                   new Polygon3DPoint(xCenter + sizeX/2.0, zCenter - sizeZ/2.0)};
              polygon.YMin = yMin;
              polygon.YMax = yMax;

              _chart.View3D.Polygons.Add(polygon);
              return polygon;
          }
同じ列と行インデックスを持ち、スタック インデックスが指定の値より低い棒グラフを探し、その後、棒グラフの底を計算します。
void SolveYMinMax(Bar bar, out double yMin, out double yMax) { yMin = 0; yMax = 0; IEnumerable barsWithSamePosition = _listBars.Where(b => b.ColumnIndex == bar.ColumnIndex && b.RowIndex == bar.RowIndex && b.StackIndex < bar.StackIndex ); double sum = barsWithSamePosition.Sum(b => b.Value); yMin = sum; yMax = sum + bar.Value; } } public class Bar { public int RowIndex; public int ColumnIndex; public int StackIndex; public int Value; public int Bar(int columnIndex, int rowIndex, int stackIndex, double value) { RowIndex = rowIndex; ColumnIndex = columnIndex; StackIndex = stackIndex; Value = value; } }- アプリケーションをビルドおよび実行します。
