


HeapAgent クイック サンプル (英語)
HeapAgent を使用したオーバーライト、ダブルフリー、リークの検出方法をご紹介します。
Table of contents
Finding overwrites
Finding double-frees
Finding leakage
SmartHeap and HeapAgent are trademarks of MicroQuill Software Publishing, Inc.
Bounds-Checker is a trademark of Nu-Mega Technologies, Inc.
Microsoft and Windows are registered trademarks and Visual C++, Win95, Win32s, and WindowsNT are trademarks of Microsoft Corporation.
Borland C++ is a trademark of Borland International, Inc.
Watcom C/C++ is a trademark of Watcom International Corp.
All other trademarks are the property of their respective holders.
ゥ 1993-1997 MicroQuill Software Publishing, Inc.
Finding overwrites
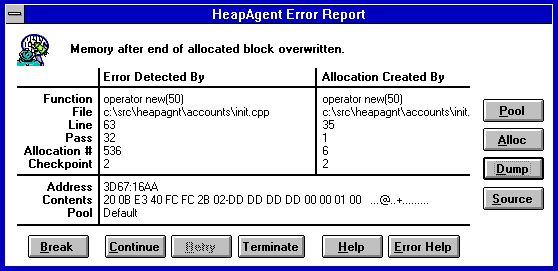
- When HeapAgent detects an overwrite, an Error Report dialog box appears. This dialog box tells you about the call that detected the error and the call that allocated the overwritten object. For each call, HeapAgent reports file, line, allocation number, checkpoint, contents, and pass count. (If a given line of code allocated more than one object, the pass count ties an error to a specific object. This is more meaningful that merely tying an error to a source line.)
Note HeapAgent's overwrite detection is complete. Unlike Bounds-Checker, which only catches overwrites beyond the end of allocated blocks, HeapAgent also detects underwrites before the beginning of allocated blocks, overwrites over internal heap data structures, and wild overwrites.
- When you choose the Dump button, HeapAgent takes you straight to the location of the error by automatically highlighting the first byte of the overwrite in red:
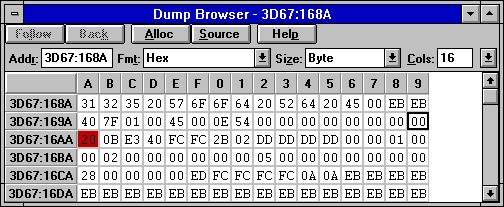
- If you aren't fluent in hex, you can select any byte or range of bytes and display the memory in meaningful formats such as string, decimal, float, ASCII, and so on. You can also use the Follow and Back buttons to follow pointers to and from other memory locations.
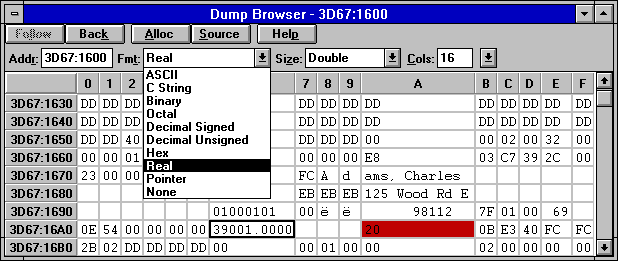
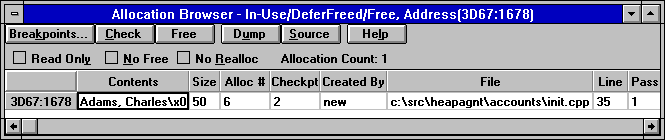
- Judging by the location of the first overwritten byte, the object whose value begins "Adams, Charles" apparently overran the amount of memory that was allocated for it. To confirm this, you can display all of the information available on this object, including its declared size, in HeapAgent's Allocation Browser.
To display the Allocation Browser, select a cell within the object and choose the Alloc button.
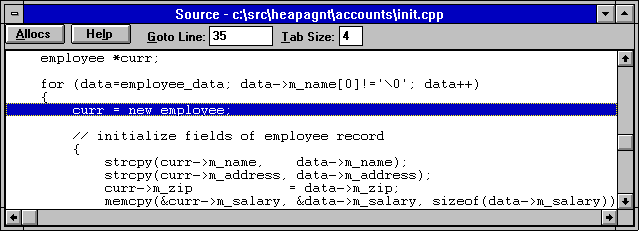
- To display the source code that allocated this object, just select a cell within the object in the Dump Browser and click the Source button:
Return to the Table of contents.
Finding double-frees
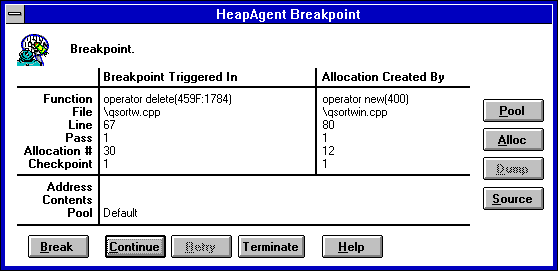
- When HeapAgent detects a double-free, the Error Report dialog box tells you where the double-free was detected and where the double-freed object was allocated. Assume that a quick check of the source where the error was detected (qsortwin.cpp, line 48) reveals that this delete looks like the correct delete. Now you need to find the first call to delete. With other tools, you'd be stuck - with no way to find the call. With HeapAgent, on the other hand, you have the tools you need to directly zero in on the location of this first delete.
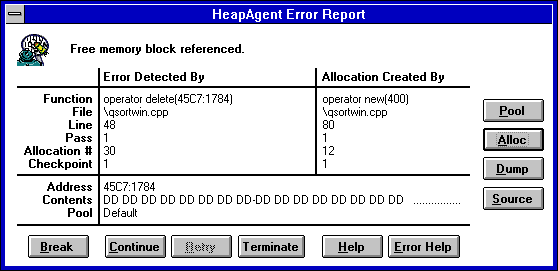
- From the Error Report dialog box, you can choose the Alloc button to display an Allocation Browser that contains complete information about the allocation that was double-freed.
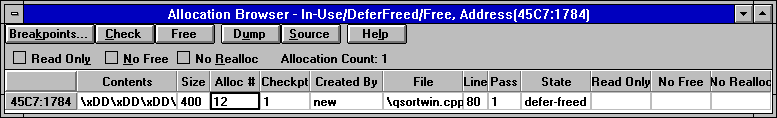
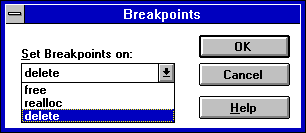
- Then, by choosing the Breakpoint button in the Allocation Browser, you can set a "heap-event breakpoint" that breaks when this specific allocation is first deleted. (Note that no other tool allows you to set "heap-event breakpoints" like this.)
- With the HeapAgent breakpoint defined, you simply re-run the application and HeapAgent breaks at the precise location of the first delete. With the ability to break on both calls to delete, HeapAgent eliminates the guesswork (and wasted hours) associated with finding the cause of elusive double-frees.
Note Using a technique called "deferred freeing," HeapAgent can catch every double-free - not just some of them. If you turn deferred freeing on, HeapAgent marks freed allocations as free but doesn't actually recycle the associated memory. Because the memory isn't recycled, deferred freeing guarantees that HeapAgent will detect subsequent references to freed memory. Other tools, including Bounds-Checker, detect double-frees only if the previously freed block hasn't, by chance, been recycled. (In addition to turning deferred freeing on or off, you can also specify how long allocations should be retained in the deferred freeing queue before they're recycled.)
Return to the Table of contents.
Finding leakage
- When you run a leakage report, HeapAgent displays an Allocation Browser that contains detailed information on the objects that are still in use:
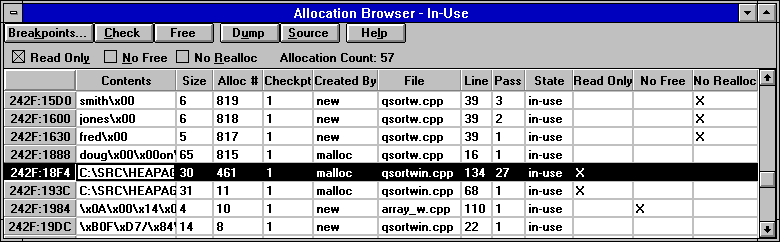
All leakage tools give you file and line information. However, in too many cases, a single line of code makes hundreds of allocations, while only a few of those allocations constitute leakage. So you're still left in the dark as to where the leaks are.
HeapAgent's leakage reports are laser precise, identifying the file, the line, and, for source lines that create more than one object, a pass count that ties the leak to a specific object. (And HeapAgent, unlike Bounds-Checker™, traps the actual line in your application that called new, not the internal system call to malloc.)
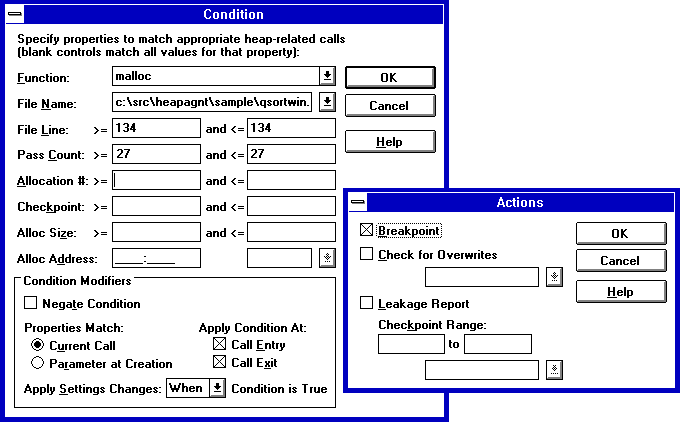
- HeapAgent not only reports the crucial pass count but also lets you put this information to good use. You can establish a "heap-event breakpoint," or "agent," that automatically breaks when, and only when, a particular object is allocated. For the highlighted leak shown above, you specify an agent to break on the 27th pass through qsortwin.cpp, line 134.
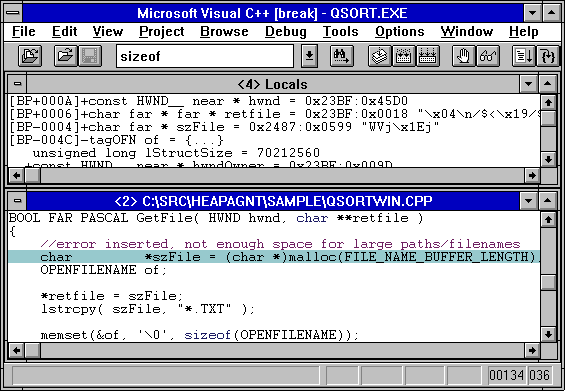
- With the agent established, HeapAgent will stop the program precisely when the leaking object is allocated, notifying you with a Breakpoint dialog box (not shown here). From the dialog box, you simply choose the Break button to instantly jump to your favorite debugger, where you can examine how the allocated object is used. HeapAgent saves you from guessing precisely what is leaking and when, so debugging from here is easy.
Return to the Table of contents.
