


 |
|
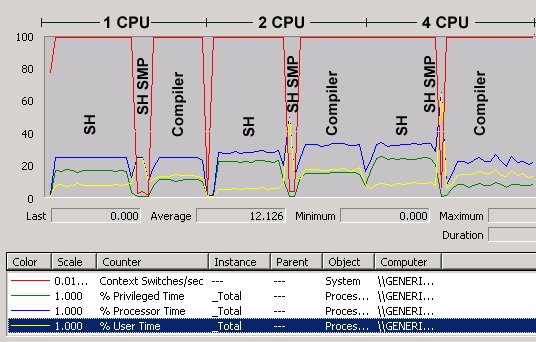
| Here's the proof! Our test case has eight
threads which call new and delete in equal proportion and is run first on
one CPU, then on two CPUs and then on four CPUs. We compiled with Visual
C++ 6, ran it on Windows2000 Advanced Server and used Performance Monitor
to log and evaluate the results.
Note the three yellow spikes that occur when the SmartHeap for SMP test is running, but that do not occur when the compiler library is used. These yellow spikes represent jumps in user-mode CPU utilization (i.e. app code not system code) when the SmartHeap for SMP version is run. The compiler library, on the other hand, shows near constant CPU utilization regardless of the number of processors available. In other words, only SmartHeap for SMP effectively utilizes the additional CPU capacity. Second, note the values for the red line. This line represents the number of context-switches per second. For the compiler library, the red line is off the chart as a result of the zillions of context switches occurring. With SmartHeap for SMP the red line is near zero because it has been optimized to reduce heap contention and the associated context switches. The blue lines are total processor time and the green lines are privileged CPU time (i.e., system calls) -- so green plus yellow equals blue. Note that during the SmartHeap for SMP tests, the yellow lines overlay exactly on the blue lines, meaning there were very few context switches and almost no time spent in system calls. Evaluation units are available. Please contact us for eval form and pricing information. |