LightningChart JS

Lightning-Fast Data Visualization Charting Library for JavaScript and TypeScript

The Highest-Performance Charting Library for the Web

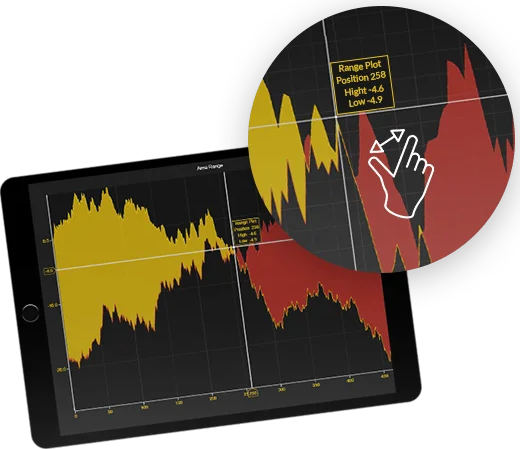
LightningChart® JS comes with an outstanding execution performance ‑ monitor dozens of data feeds simultaneously using high data rates.

GPU acceleration and WebGL rendering ensure that your device’s graphics processor is utilized efficiently, which results in high refresh rates and smooth animations.

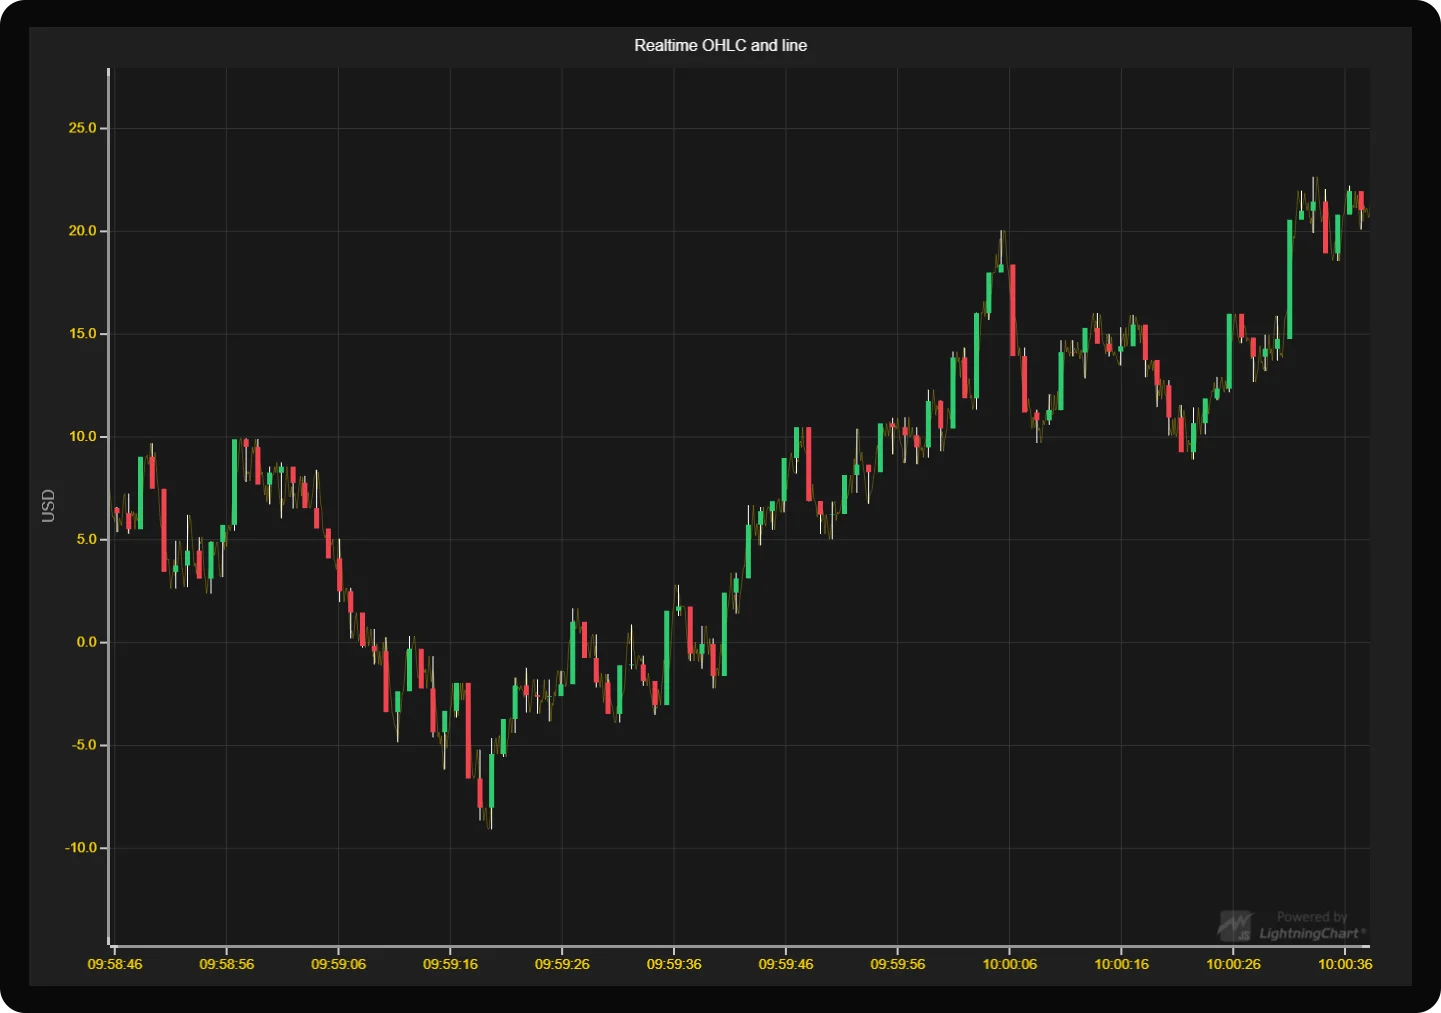
Performance indicators up to MILLIONS of data points in a real time.

General Information

  • Optimized for real-time data visualization and high-speed streaming data
  • Fully GPU accelerated (WebGL)
  • Zooming and panning, with mouse and touch-screen
  • Dashboard to manage layout of several charts and resize columns and rows definition and so on
  • All common transitions have toggleable, fluid animations

Cross Browser Compatibility

  • Google Chrome
  • Mozilla Firefox
  • Microsoft Edge
  • Safari
  • Opera

Features

LightningChart JS enables the data visualization in various series.


XY Charts

  • Series types: Line and point series, area series, area range series, OHLC series, rectangles, ellipses, box-whisker and line segment series.
  • Scaling modes: Fitting, Expansion, Progressive/Regressive, and Manual
  • Linear axes can be placed left/right/top/bottom and possibility to have several X and Y axes per chart.
  • Markers and data cursors have customizable shape and styles.

Radar / Spider charts

  • Scaling modes: Fitting, Expansion, and Manual
  • Categorical automatically generated axes.
  • Round and lines grid.
  • Line, point and filled area series.
  • Data cursors have customizable shape and styles.

Pie / Donut charts

  • Slices can be styled using different fill and border-styles.
  • Fully customizable sorting and formatting of slices.
  • Slice value transitions as well as disposing/restoring are animated.
  • Labels can be set on side with connector-lines or inside Slices
  • Slices can be “exploded” programmatically or by mouse/touch.

Funnel Charts

  • Slices can be styled using different fill and stroke styles.
  • Slices can have empty gaps in between.
  • Fully customizable sorting and formatting of slices.
  • Labels can be set on side with connector lines or inside slices.
  • Two different ways to show the slices based on their values: Variable width and Variable height.
  • Slices can be animated. Changing values of slices, adding and removing slices support animations.
  • User can enable or disable animations for all slices.

Gauge Charts

  • Gauge can be styled using different fill and stroke styles.
  • Set the thickness of the Gauge.
  • Gauge Slice can be styled using different fill styles.
  • Fully customizable formatting and styling of slices.
  • Customize the start and end angles of the gauge.
  • Customize the value interval of the gauge.
  • Gauge value change, interval and angle transitions and gauge dispose/restore are animated.

Pyramid Charts

  • Slices can be styled using different fill and stroke styles.
  • Slices can have empty gaps in between.
  • Fully customizable sorting and formatting of slices.
  • Labels can be set on side with connector lines or inside slices.
  • Slices can be animated. Changing values of slices, adding and removing slices support animations.
  • User can enable or disable animations for all slices.

System Requirements

Library Distribution Channels
  • NPM package, JavaScript, TypeScript typings included
  • IIFE JavaScript library for including in traditional HTML page, TypeScript typings included in the downloadable archive in the Customer Portal
Hardware
  • Lately updated drivers/software
  • WebGL compatible graphics hardware
Internet Connection
  • Development:
    • Development with a Commercial development key requires internet connection for license key checking
    • Community license currently doesn’t currently require internet connection in development.
  • Deployment:
    Commercial license and Community license allow deployment on public web sites.
    • Internal solution on internet or cloud developed with Commercial license requires internet connection.
    • Internal solution on local area network developed with Commercial license requires local area network connection.

Comprehensive Set of Examples


Interactive Examples

The Interactive Examples contain dozens of samples and code modification on-the-fly.

View Examples »


Performance Tester

LightningChart JS performance tester allows users to test the performance of scatter series, scrolling line series, scrolling area series, scrolling point line series, OHLC series, and dashboard by assigning specific duration and repeat count.

Test Performance »


Top