Visual Studio Charting Component for Data Visualization on WPF and Windows Forms Application
.NET Chart for the Most Demanding Developers
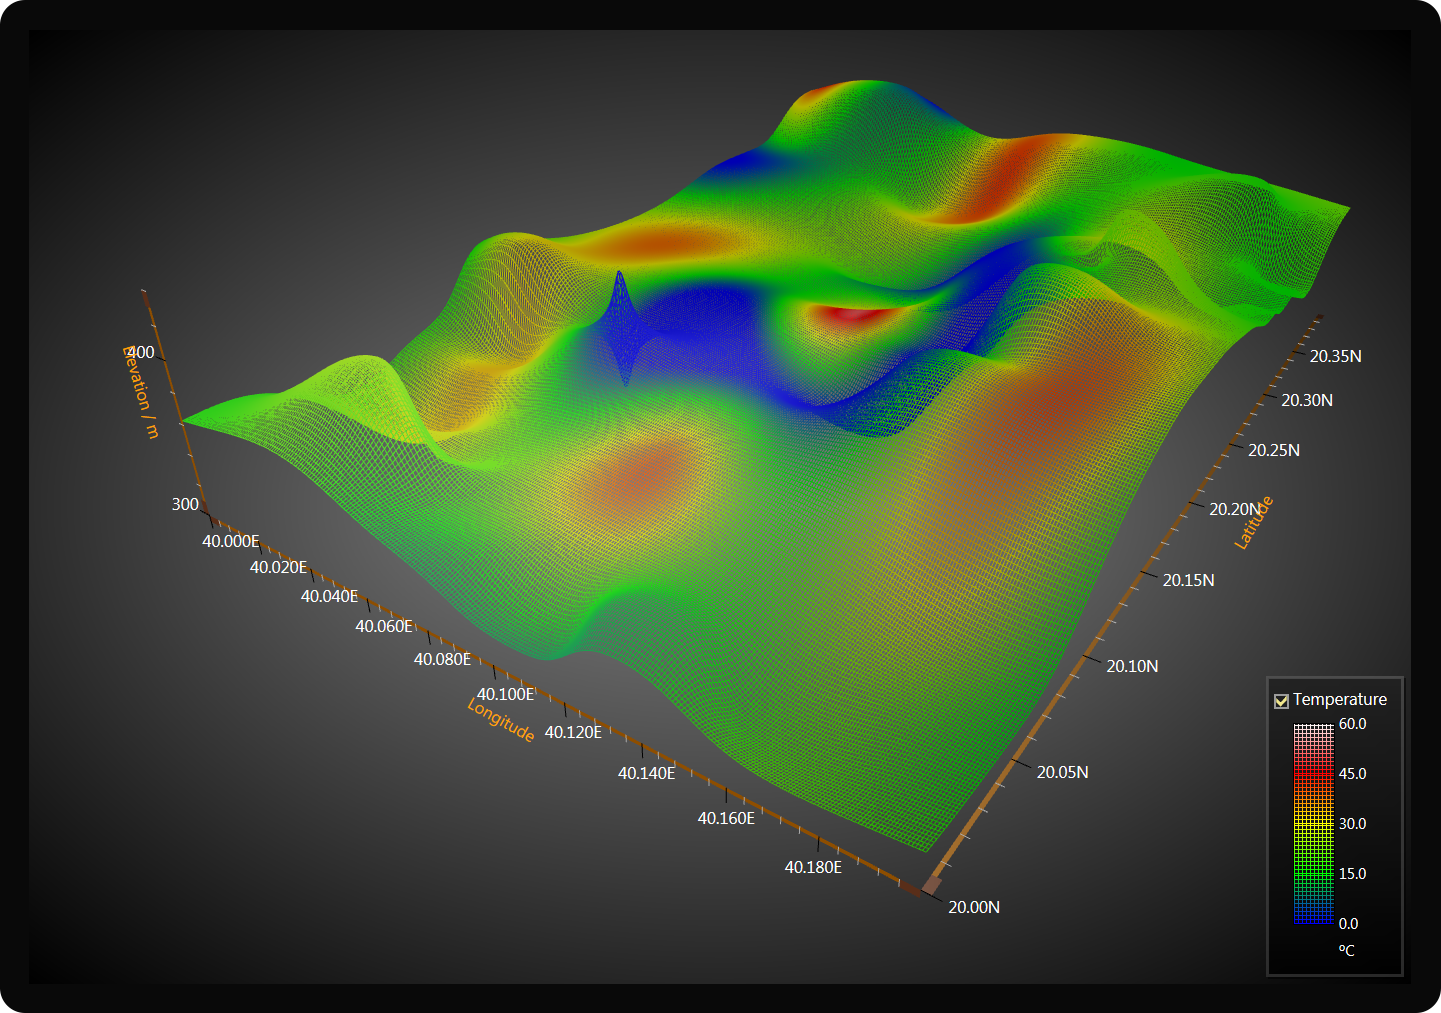
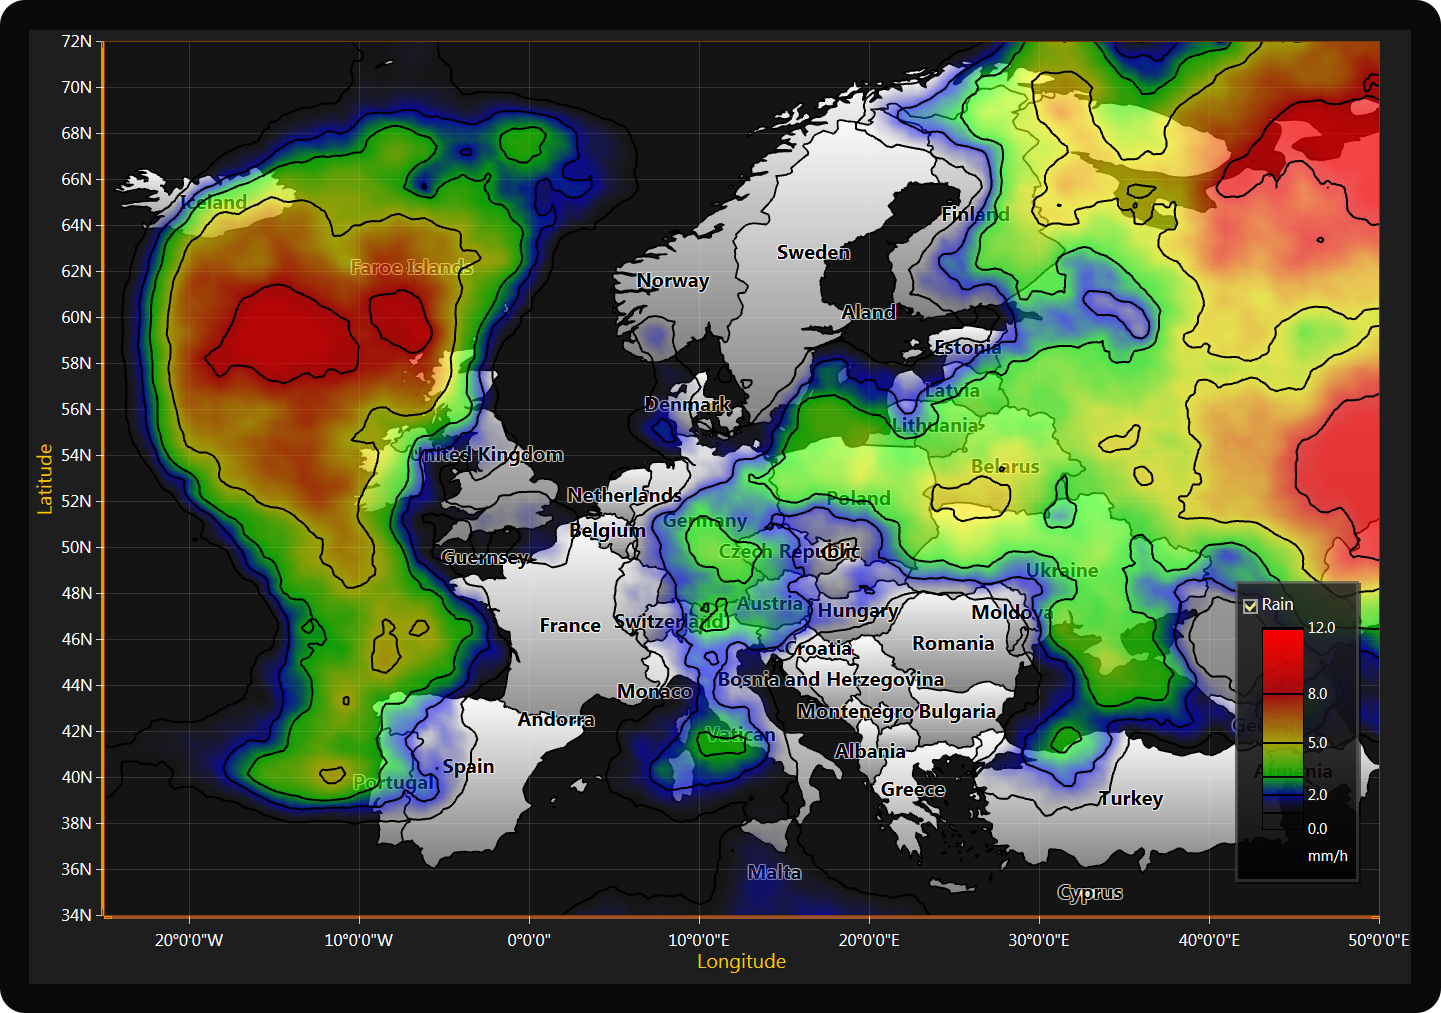
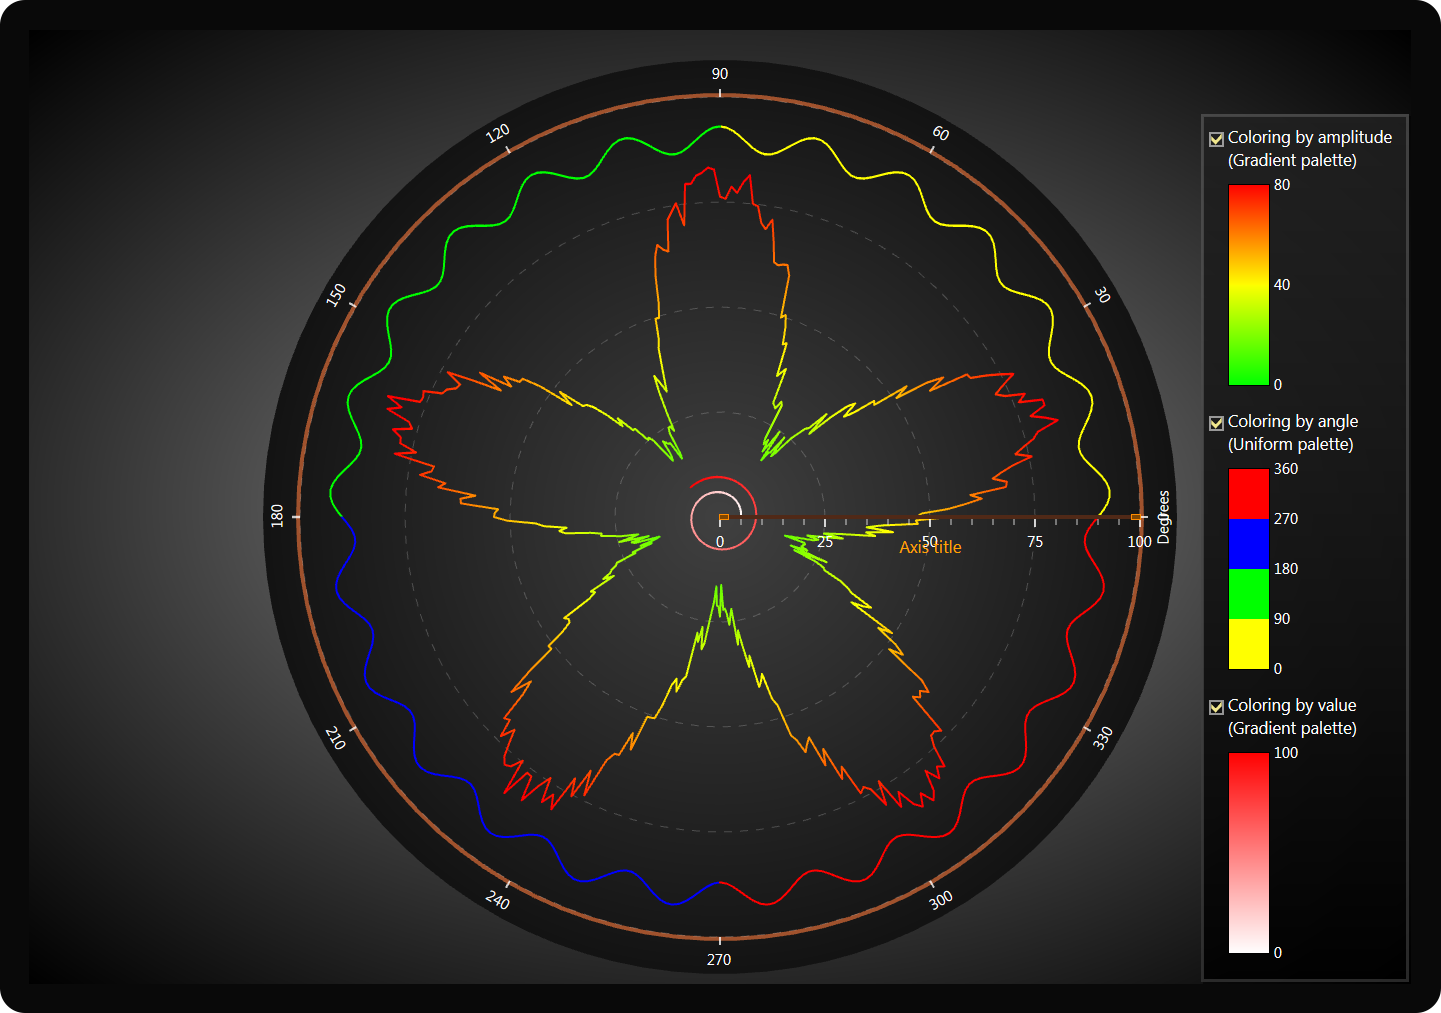
LightningChart includes a wide range of 2D, advanced 3D, Polar, Smith, 3D pies / donuts, Geographic maps & G.I.S.
charts for science, engineering, medicine, aerospace, trading, energy and other fields.
Along with an outstanding performance, LightningChart offers fully customizable tools and flexibility to the .Net
developers within different industries.
0:13 - Business Charts
1:47 - Finance and Trading
2:40 - Geography and Maps
3:42 - Measurement and Digital Signal Processing
5:38 - Science and Engineering Charts
8:44 - Volume Rendering
General Information
Real-time monitoring without flickering or delays
Efficient use of machine resources and high-resolution datasets
Ability to render data with older machine hardware
Full mouse-interaction, touch screen support, custom mouse interactivity extensions
Numeric, Time, DateTime, Logarithmic, Geographic Coordinate System (GCS) and Custom axis scales
Rendering Technology
DirectX 11 & DirectX 9 support
Automatic software rendering with WARP in systems without graphics hardware and for virtual machines
Selectable fonts quality
HiDPI scaling support
Can be run in both 32-bit and 64-bit modes
Features
Watch the sample videos by clicking the chart images!
Bronze Package
Silver Package
Gold Package
Platinum Package
Bronze Package includes XY charts.
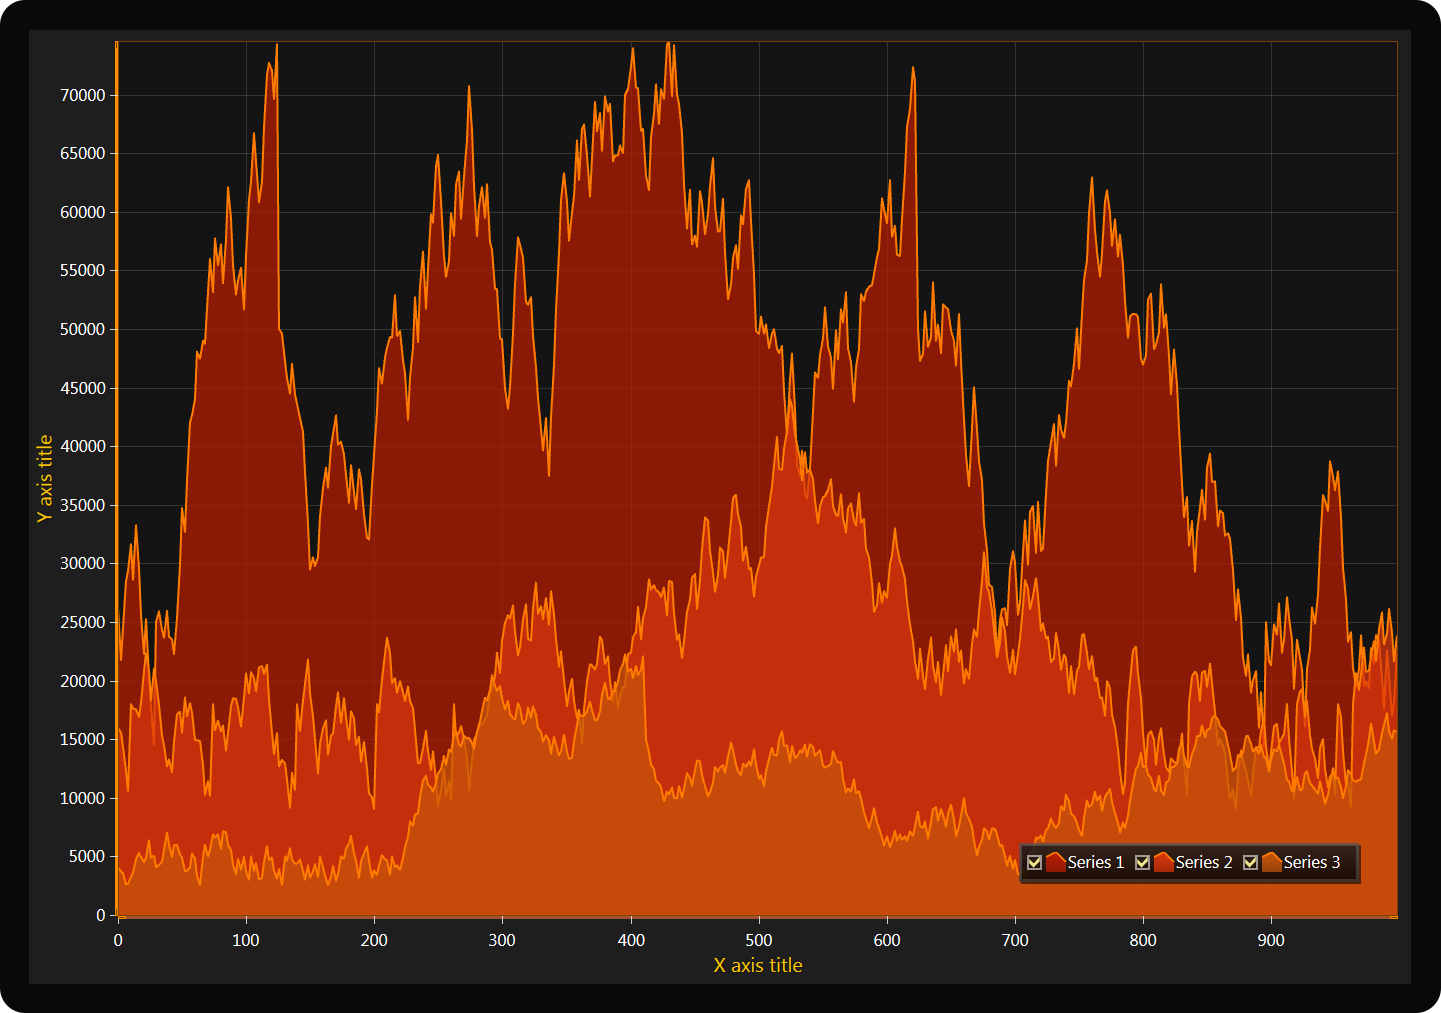
XY charts
Series types: sampled data (discrete signal), point-line, freeform point-line, areas, high-low,
polygon, stock (candle-stick), bar, band, constant line, intensity grid, intensity mesh
SignalReader: SignalReader generates real-time data stream reading signal files in different formats:
WAV (PCM), sid (biosignal file), ssd (LightningChart Ultimate Demo application sample data format). The playback
can be automatically restarted with looping option.
AudioInput: Reads real-time sampled data stream from sound card line-in (using e.g. microphone)
through DirectSound. The data can be forwarded to chart, AudioOutput or your own data target.
SignalGenerator: SignalGenerator is a multi-functional signal generator component. It allows combining
different waveform types into single, real-time output signal. The waveform components can be set with a built-in
user interface or by code.
SpectrumCalculator: Converts data between time domain and frequency domain using Fast Fourier
Transform (FFT) algorithm in Digital Signal Processing (DSP).
AudioOutput: Allows real-time data stream playback via sound card line-out (using e.g. speakers)
through DirectSound. The data can be fetched from SignalGenerator, SignalReader, AudioInput or other data source.
Platinum Package includes volume rendering features as well as the charts and features included
in Silver Package and Gold Package.
XY charts
Series types: sampled data (discrete signal), point-line, freeform point-line, areas, high-low,
polygon, stock (candle-stick), bar, band, constant line, intensity grid, intensity mesh
SignalReader: SignalReader generates real-time data stream reading signal files in different
formats: WAV (PCM), sid (biosignal file), ssd (LightningChart Ultimate Demo application sample data format).
The playback can be automatically restarted with looping option.
AudioInput: Reads real-time sampled data stream from sound card line-in (using e.g. microphone)
through DirectSound. The data can be forwarded to chart, AudioOutput or your own data target.
SignalGenerator: SignalGenerator is a multi-functional signal generator component. It allows
combining different waveform types into single, real-time output signal. The waveform components can be set
with a built-in user interface or by code.
SpectrumCalculator: Converts data between time domain and frequency domain using Fast Fourier
Transform (FFT) algorithm in Digital Signal Processing (DSP).
AudioOutput: Allows real-time data stream playback via sound card line-out (using e.g. speakers)
through DirectSound. The data can be fetched from SignalGenerator, SignalReader, AudioInput or other data source.
System Requirements
OS
Windows Vista, 7, 8, 10
Windows Server 2008 R2, 2012 R2, 2016
*Both 32-bit and 64-bit versions are supported.
DirectX
DirectX 9.0c (shader model 3) level graphics adapter or newer
DirectX 11 compatible operating system with Direct2D 1.1
*Rendering can be done without graphics hardware. *DirectX11 compatible graphics hardware
recommended.
Visual Studio
Visual Studio 2010, 2012, 2013, 2015, 2017, 2019
Not required for deployment
Development Framework
.NET Framework 4.0 or newer
.NET Core 3.0 (WinForms and WPF libraries)
*LightningChart source code does not support compilation as .NET Core 3.0 libraries.
Edition Comparison
For WPF, LightningChart component is available in different binding level editions, to balance between different performance and MVVM (Model – View – View-Model) bindability needs.
As a general starting point, LightningChart recommends Semi-bindable API.
For best performance in WPF and multithreading benefits, select Non-Bindable chart.
We use cookies to ensure you get the best experience on our website. If you would like to know more about how we use cookies, please see our Privacy Policy. By using our website you consent to all cookies in accordance with our Privacy Policy.